Non destructive techniques to detect and monitor the sub-surface behaviour of a
salt-water solution within a sand-gravel aquifer
Baradello Luca, Bratus Antonio, Emanuele Lodolo, Nieto Yabar Daniel
(2nd Conference on Salt Water Intrusion in Coastal Aquifers:
Monitoring, Modelling and Management, Meridan Mexico, 2003)
Abstract
A pilot test has been
performed in the NE of Italy to detect and monitor the sub-surface behaviour of
a salt-water solution within a sand-gravel aquifer. Two geophysical,
non-destructive techniques have been used and combined: multi-electrode
tomography and Ground Penetrating Radar profiling. The experiment consisted in
pumping two cubic meter of salt-water solution – which presents a high
conductibility value - into a well, in order to detect variations of resistivity
vs. time during the flow of the solution within the aquifer.
Geophysical data have been repeatedly acquired to measure the flow velocity
within the aquifer, on the basis of occurrence of resistivity changes. The
experiment has required a specific geometry for the geo-electric acquisition,
taking into account the target depth (from 4 to 20 m), short acquisition time,
high-resolution tomography.
The experiment has proven its potentiality in identifying the presence of the
contaminating solution and monitor its diffusion flux within the aquifer.
Introduction
This experiment is carried on in collaboration with the Dipartimento di Scienze
Ambientali, Geologiche e Marine of the University of Trieste.
The university staff is studying the behaviour of an aquifer using several
methods. This is an opportunity to test the efficacy of GPR and ERT in detection
the water movement. Using the injection of a salt solution in the well n. 1 it
is possible to define with a time-lapse survey the feature of this movement. The
results are really interesting because they are useful in pollution case too.
Site
description
The site test is located in the Osoppo plane, a particular
environment in the North of the Friuli Venezia Giulia region in Italy.
The area is characterized by a stratigraphy with permeable sedimentary deposits
having sometimes inside lens of cemented gravel; it is near a water flow and the
water table is close to the surface. By a morphological point of view the meadow
is a first order terrace of the Tagliamento river. Two embankments 2 m high are
present, one delimits the northern part of the area, the other delimits the
SW-part. The mainly direction of water flow is N-S and bibliography data of
water velocity indicates it between 1.5 and 2.3 m/h.
ERT survey
The target of the survey is the detection of the
resistivity anomaly due to the injection of salt water solution in the
subsurface. Two lines of 32 electrodes having 5 m electrodes spacing are placed
on field. The multielectrode data is collected by the use of a resistivimeter
Syscal R2 and a Multinode system by Iris Instruments. The two lines named
OS-e01-02 and OS-e02-02 are nearly perpendicular: The line OS-e01-02 has a N-S
direction and intersect the well n. 1 between the electrodes 9 and 10. This line
has the same direction of the water flow and it is used for the time lapse
survey for the monitoring of the salt solution. The other line is far 45 m S
from the well n. 1 and has a E-W direction. Its function is the possibility to
detect lateral water movements. The acquisition geometry used is
Wenner-Schlumberger. All the data are inverted using the RES2DINV software. The
resistivity models of the two lines acquired before the injection of salt
solution give a lot of information on the subsurface. In both lines it is
possible to characterize the high resistivity structure of the banks while it is
evidenced as the superficial part of the inner zone to the banks is
characterized from the presence of a superficial low resistivity level due to
the presence of sand deposits. Such level is approximately 5 m of thickness,
after there is a resistivity increase because of the presence of an horizon,
thick approximately 10 m of “clean” gravels, water saturated, to whose inside is
noticed some lens of cemented gravel having high resistivity values. The depth
increase create low resistivity values because of gravel with fractions of finer
sediments, water saturated. This description is in agree with the drill data.
The injection of salt water occurs at a depth between 10 and 20 m, because of
this it was necessary to optimise the multielectrode acquisition. A good
compromise between fast data acquisition and model detail is required. Of course
a complete sequence of acquisition isn’t useful, because it would take so much
long time. A new sequence is created: with 182 quadripoles is possible to
investigate a depth between 10 and 20 m in about 15 minutes. This sequence is
used for the time-lapse survey and the monitoring of the water movement. After a
first measurements without salt, at 09.11 start the solution injection.
Analysing the resistivity models acquired at different times in the same day, is
possible to define the resistivity variation due to the presence of the salt
solution.
It is possible to define two different area of water movement in the model:
1) the upper part where a vertical component predominates because of the shadow
effect of the embankment structure, that stops the water flow
2) the lower part, not having the effect of the embankment structure, where
predominates an horizontal components in the water flow and the water velocity
decrease with depth
In this part of subsurface the calculation of the horizontal velocity is
possible. At different depths the resistivity lines shift is observed. The
maximum velocity is at a depth of 12 m from the surface (depth 168 m) where a
velocity of 1.44/m/h is measured, the minimum velocity is 0.39 m/h at depth 165
m, the deeper velocity calculation made. The calculate average velocity is of
0.84 m/h.
We created a diagram obtained by observing the shift of a fixed resistivity line
at different depth. It is possible to see the different phases of salt injection
and the same trend at different depth. If we see the effect of the salt solution
in the whole model, the time gap between the upper an the lower resistivity
model is of 8 hours. Many important difference are present near the well. The
sal 11-4 model has lower resistivity values in the well area comparing to the
sal 11-0 model. But the presence of cemented gravel may be an obstacle to the
water movement, in fact at 20 m far from the well no changes are observable in
the two models.
Georadar survey
The transmission of electromagnetic
waves into the ground depends on the electric media properties: dielectric
constant and conductivity. The first parameter is related to phase velocity and
the second to attenuation. The salt injection increases the conductivity of
subsoil and blocks the penetration of electromagnetic wave.
Georadar survey covered an area of 20 x 40 mq where we
acquired 5 (A,B,C,D,E) x 9
(F,G,H,I,L,M,N,O) parallel profiles with a distance of 5 m.
[Injection is A-F start] The data was collected with a
GSSI SIR 2000 equipped with portable monostatic SubEcho antenna (nominal
frequency of 70 MHz). The principal characteristics of SubEcho are no coupling,
i.e. it doesn't need to be in contact with ground, and a good direction pattern.
We took it 30 centimetres from irregular surface. The traces, 32 scan for
second, have 600 ns and 1024 samples (16 bits dynamic range). The acquisition
grid was repeated ten times (between two acquisition was not regular interval
time). After trace geometry, all profiles are processed with following
procedure:
o Spectral and decay analysis
o Amplitude recovery (attenuation and spherical divergence with mean velocity =
7cm/ns)
o Band pass filtering
In this soil the electromagnetic wave has a good penetration, in several areas
we have signal until 250 ns (ca. 8-10 meters). In all profile there was a lot of
environmental noise (high frequency) and lateral waves from surface objects.
The sections B,C,D,E,H,I,L;M,N,O and P don’t show differences during monitoring
(6 hours and half).
The most important amplitude and phase alteration of signals are next well. For
following these changes, with all A profiles we can build a cube. The dimensions
of cube are x=length of profile, y=time from injection and z=time of trace. Then
we can see the single timeslice at several depth.
Close the well after 20 minutes from injection at 130 ns it’s possible to see a
change of phase.
Another interesting section is G. In the profiles acquired 5h40m after salt
injection the amplitude of reflectors is low and we have an increment of high
frequency noise. This situation could be caused by an increment of conductivity.
Conclusions
This experiment demonstrates that it possible
to detect and monitor the sub-surface behaviour of a salt-water solution within
a sand-gravel aquifer with geophysical non-destructive techniques. The use of
two integrated electromagnetic methods (multi-electrode tomography and Ground
Penetrating Radar) aids in identifying the presence of the contaminating
solution within the aquifer, because the comparison of the two information
allows a more complete interpretation of the same electrical property
(conductivity).
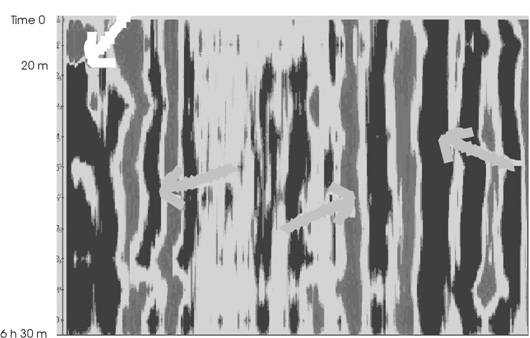
The figure illustrates a time slice at 130 ns. White arrow shows
phase change, while grey arrows the unchanged reflections. The
length of profiles is 40 m.